Project notes / Cynthia Owolabi
TrafficDesk
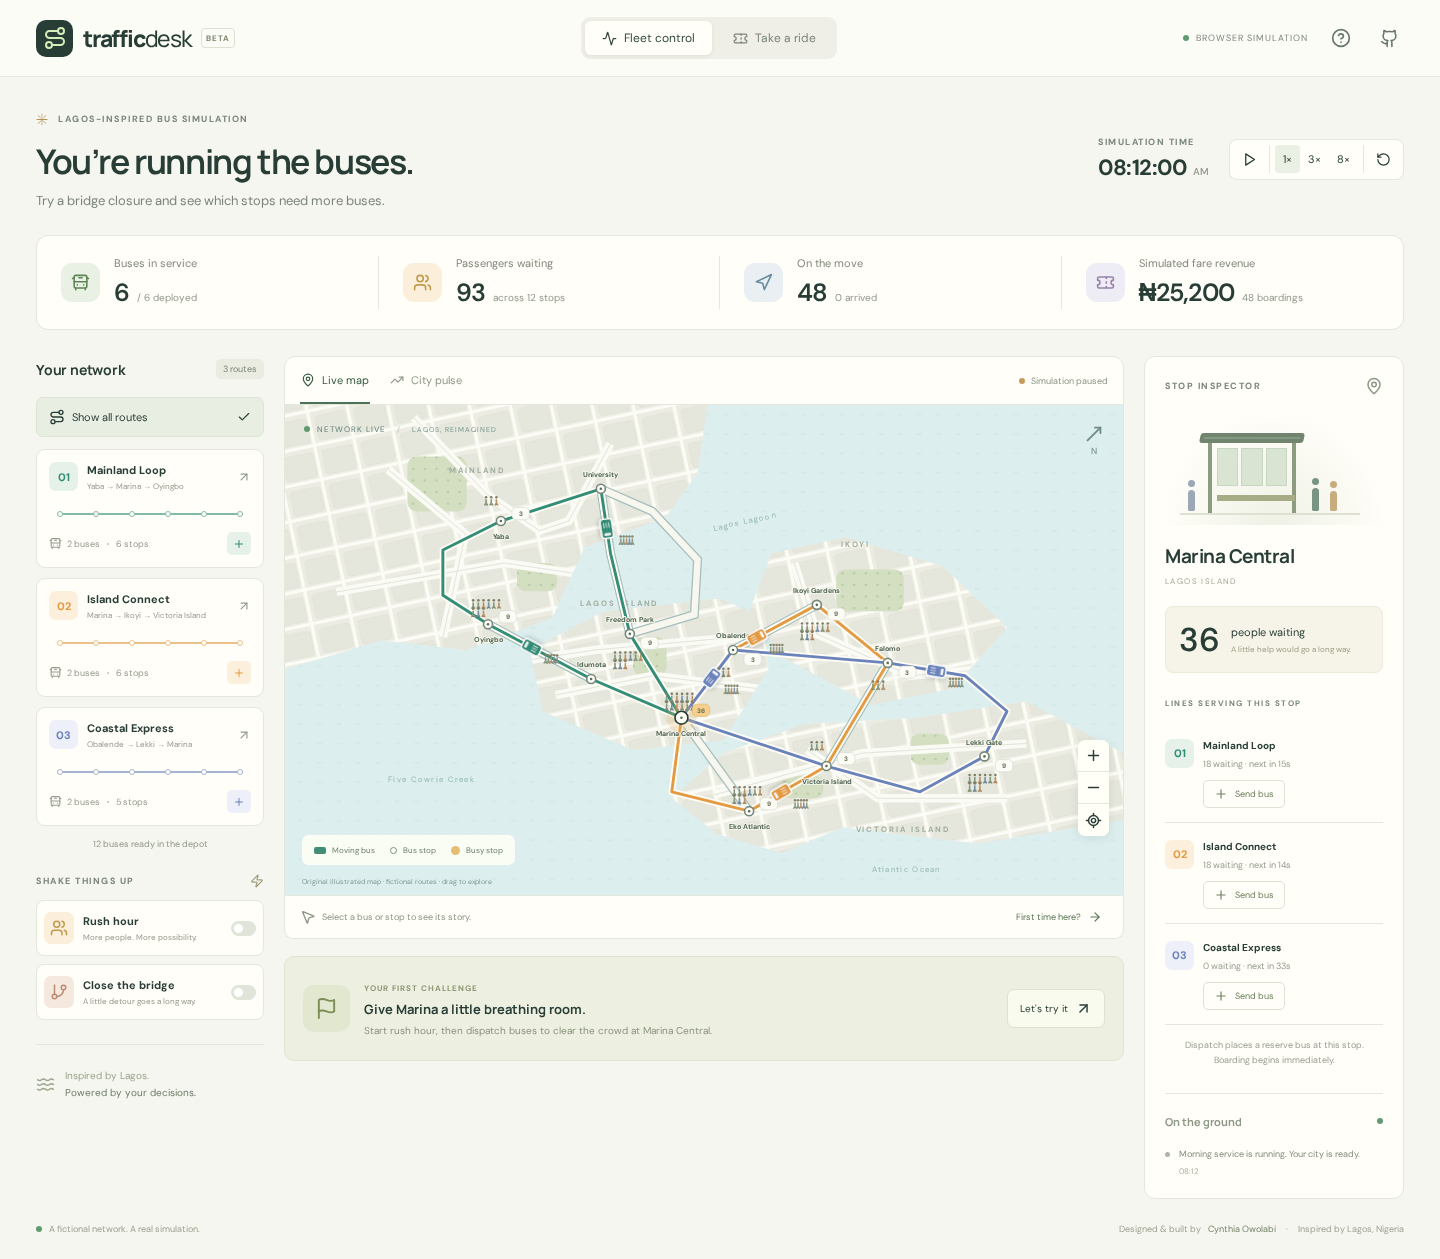
Close the bridge and buses stop departing from University. The queue grows. Open the detour and service resumes, but the longer route changes how quickly buses can return. That chain of effects is the basis of TrafficDesk.
A fictional bus network
My transport software work at Interswitch informed this project. I built a fictional network inspired by Lagos, with simulated passengers and fares. React draws the SVG map, and a TypeScript simulation updates the buses and queues. The code and sample data were created for this portfolio.
The passenger is part of the queue
The network starts with six buses across three one-way loop routes and 12 stops. Each bus has 32 seats; depot dispatch is capped at 18 buses. A demo ticket represents a passenger inside the same queue and boarding accounting used by the operator view. Boarding records revenue once, and arrival removes that passenger from the bus.
A bridge closure allows a bus already crossing to finish its leg, then holds later departures at University. Opening the alternate route resumes departures along a longer path. Breakdowns keep passengers aboard until repair.
Try a bridge closure
- Start Rush hour and select Marina Central. Observe the queue.
- Dispatch a reserve bus and watch capacity-limited boarding reduce the queue.
- Close the bridge, then open the alternate route to restore departures.
- Switch to Take a ride, get a ticket and follow the passenger to arrival.
- Open City pulse and compare six versus nine buses under the same seeded 120-second demand.
Keeping the passenger count right
A passenger should remain accounted for while waiting, riding or stuck on a broken-down bus. Tests check that counts stay consistent and that buses never exceed capacity. Demand uses a fixed seed, so the comparison can replay the same rush hour with a different fleet size. It runs separately from the city you are operating.
The simulation runs in the browser and resets on refresh. Time pauses when the tab is hidden. Keyboard controls work on the map, and reduced-motion preferences start the simulation paused.
Tests
Ten simulation tests cover conservation, deterministic replay, closure/detour behavior, complete tickets, fleet limits and causal intervention comparison. Four browser scenarios cover controls, complete rider journeys, responsive and keyboard behavior, and reduced motion using local fixtures.
npm ci
npm test
npm run build
npm run test:e2e
Simplifications
The routes and journey times use fictional parameters. Buses move at a constant speed, and reserve dispatch places a bus at the selected stop immediately. Congestion and transfer planning are outside the model's scope; fares are simulated. The map draws a sample of waiting passengers; the badges show the full counts.